How to run your forecast call with Ebsta
Here's how:
1. How much have we closed so far?
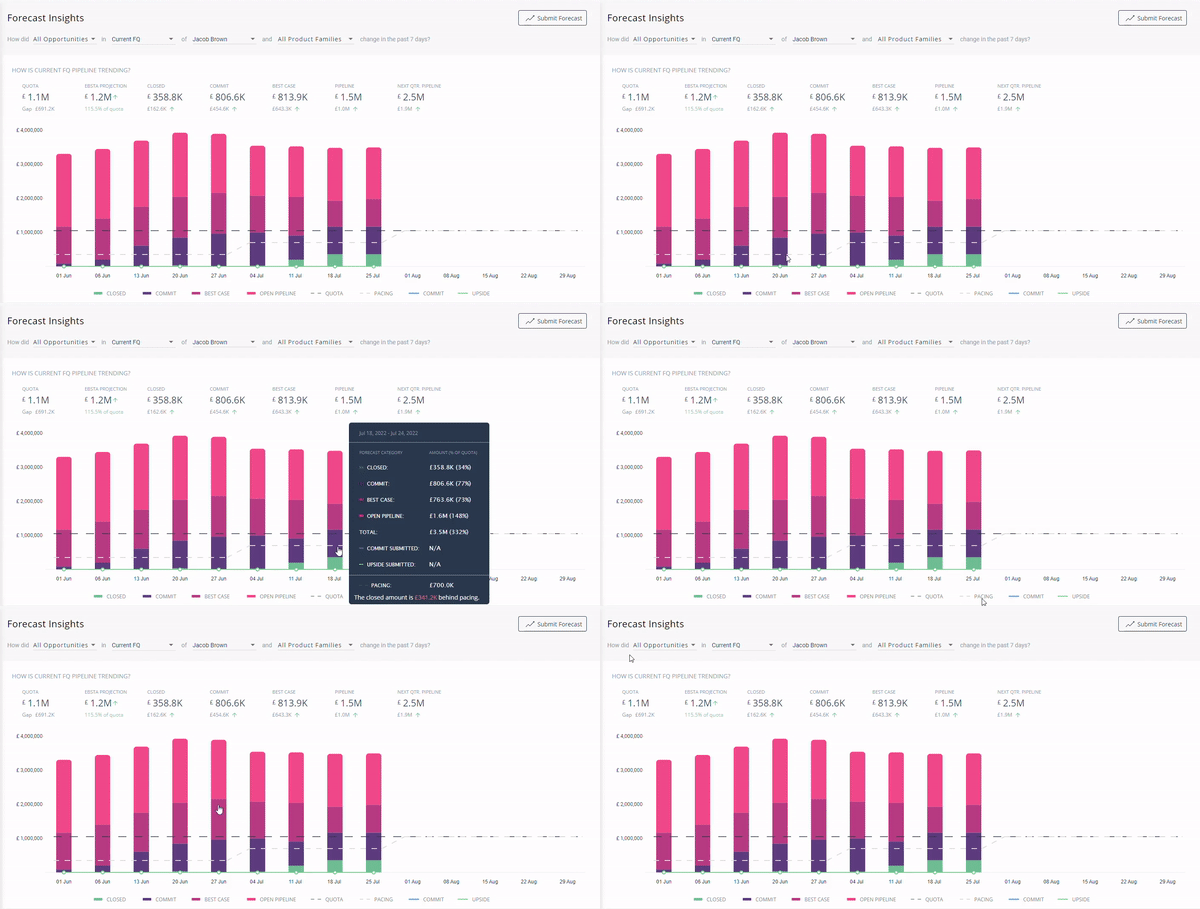
First thing you need to know is how much you have closed so far. You can find this out by using our key metrics.
This will show you how your current FQ pipeline is trending including:
- Quota
- Ebsta projection
- Closed
- Commit
- Best case
- Pipeline
- Next quarter pipeline

2. Is that on pace with our target?
Are you on track? Our pipeline trend chart can show you at a glance. When your quota is entered, Ebsta automatically enters a pacing line for your reference so that you can always see if you are on track.
The pacing line can be seen in light gray below. This quickly shows you how you are performing in relation to your quota and enables you to be proactive and create next steps so you meet your targets.

3. What is the manager’s commit?
To check the commit of a manager simply scroll down to the Opportunities Tab and select the Teams Tab.
From here you will be able to see the team submission (this is the managers submission) as well each rep’s individual submission.

4. Why is that ahead or behind the rep’s commit?
From the Teams Tab you will be able to see the team submission (this is the managers submission) as well as the reps individual submission.
You can compare and contrast forecast submissions and use this as a starting point for a conversation about discrepancies if they are present.
5. Is there a big difference between commit and upside?
The teams tab also allows you to see if there is a big difference between commit and upside. This helps you make strategic decisions.
For example if your quota is £2.5mil and you have £2.8mil in commit with £5mil in upside, you may want to focus on your upside deals.
6. Which specific deals are in the commit and upside?
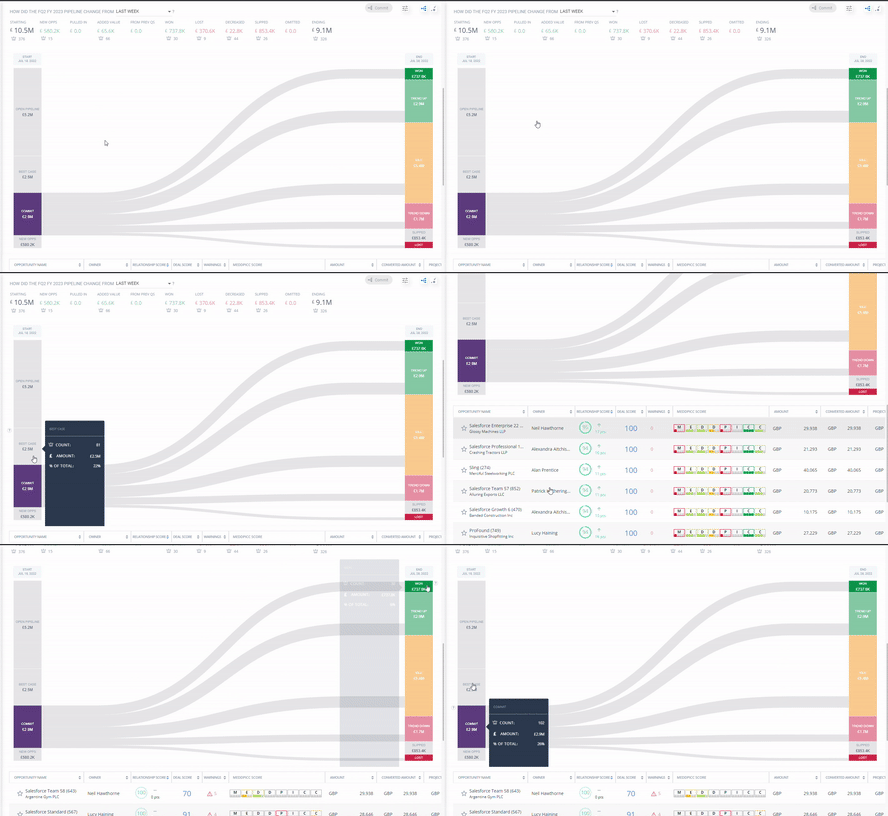
The Opportunity Flowchart shows you exactly what opportunities are in commit and upside.
The commit section of the flowchart will automatically be displayed. To check the upside simply click best case on the left hand side of the flowchart.
Select the category you want to inspect and scroll down to the Opportunity Table. From here you will be able to inspect every deal individually including Deal Score, Engagement Score, Positive & Negative Factors, MEDDPICC etc.

