Highlights of 2025 GTM Benchmarks
to Share on Social Media
Use these graphics to post on LinkedIn and other social platforms
Give your followers insights on Go-to-Market strategy and sales performance.
Download the graphics for best quality or hit the Share button for a quick post on LinkedIn. Then either copy/paste the suggested text or edit and add your own thoughts and expert advice.
For more exclusive research results, infographics and GTM guides, apply for membership of our private LinkedIn Group; B2B Revenue Intelligence.
Win Rates
Why the drop in Win Rates has slowed. In 2023, extended sales cycles (+16%), reduced deal values (-21%), and widespread quota shortfalls (69% of sellers missed) drove an 18% drop in win rates.
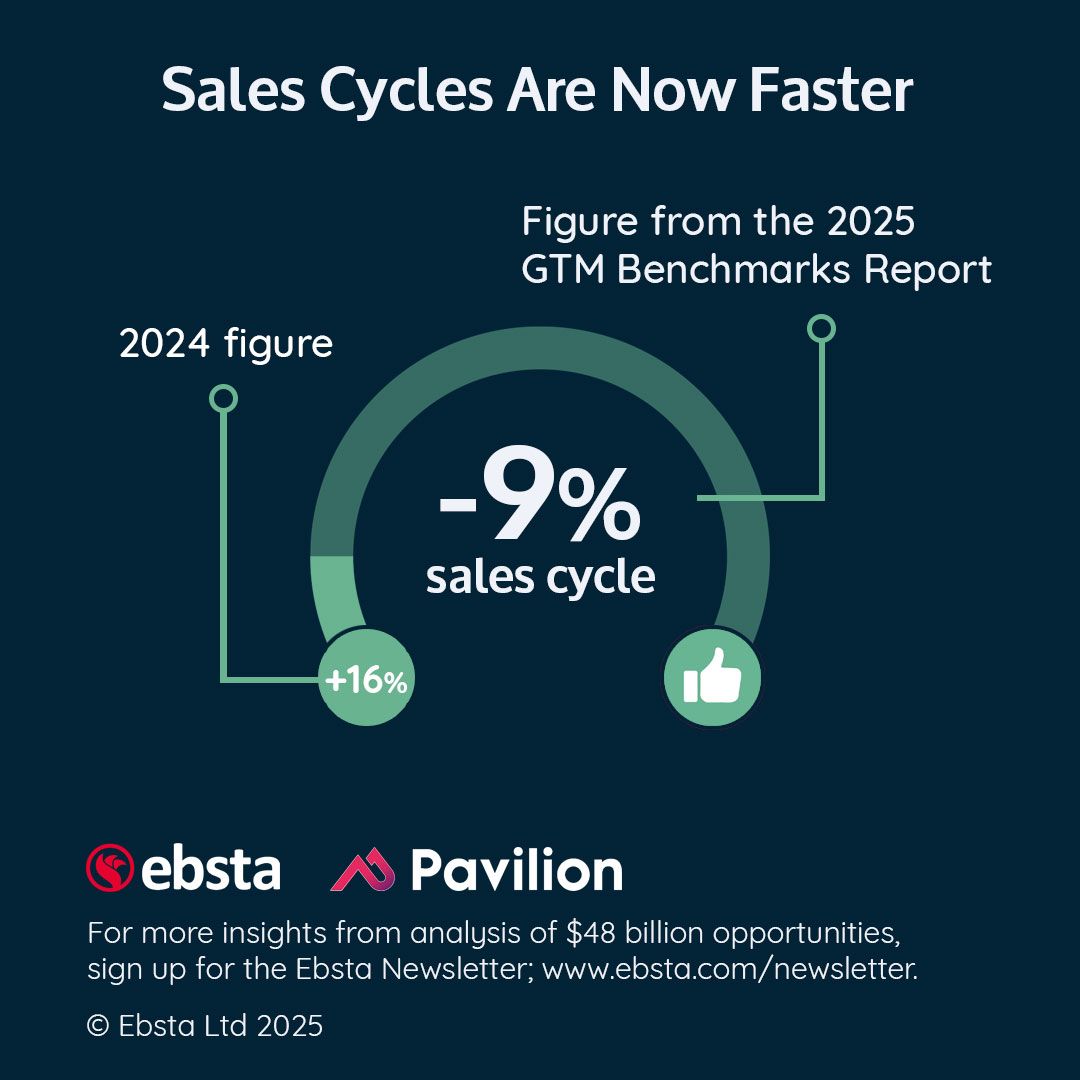
In 2024, shorter cycles (-9%), bigger deals (+54%), and fewer delayed contracts (36% slipped) stabilized performance, bringing the overall decline to just 10% this year.
#2025GTMbenchmarks
Based on $48Bn in opportunities from UK and US tech firms, Ebsta’s GTM Benchmarks Report shows win rates dropped 18% in 2023, then 10% in 2024.
Longer sales cycles (+16%) and deal value declines (-21%) drove the initial plunge in 2023. But in 2024, shorter cycles (-9%) and bigger deals (+54%) are slowing that drop.
#2025GTMbenchmarks
Quick LinkedIn Post
Optimised for social media
Sales Cycles
According to Ebsta’s GTM Benchmarks Report analyzing $48Bn from UK/US tech, 2023 saw lengthy cycles (+16%) and falling deal sizes (-21%), driving an 18% drop in win rates.
In 2024, cycles shortened (-9%) and deal values surged (+54%), leading to a smaller 10% decline in win rates compared to the previous year - despite sellers missing quota rising to 78%.
#2025GTMbenchmarks
In 2023, extended buyer evaluations and economic uncertainty prolonged sales cycles by +16%, contributing to a steeper drop in win rates (-18%).
By 2024, a surge in deal values (+54%) and improved buyer sentiment shortened cycles by -9%. However, more sellers missed quota (up from 69% to 78%), highlighting ongoing challenges.
#2025GTMbenchmarks
Quick LinkedIn Post
Optimised for social media
Deal Values
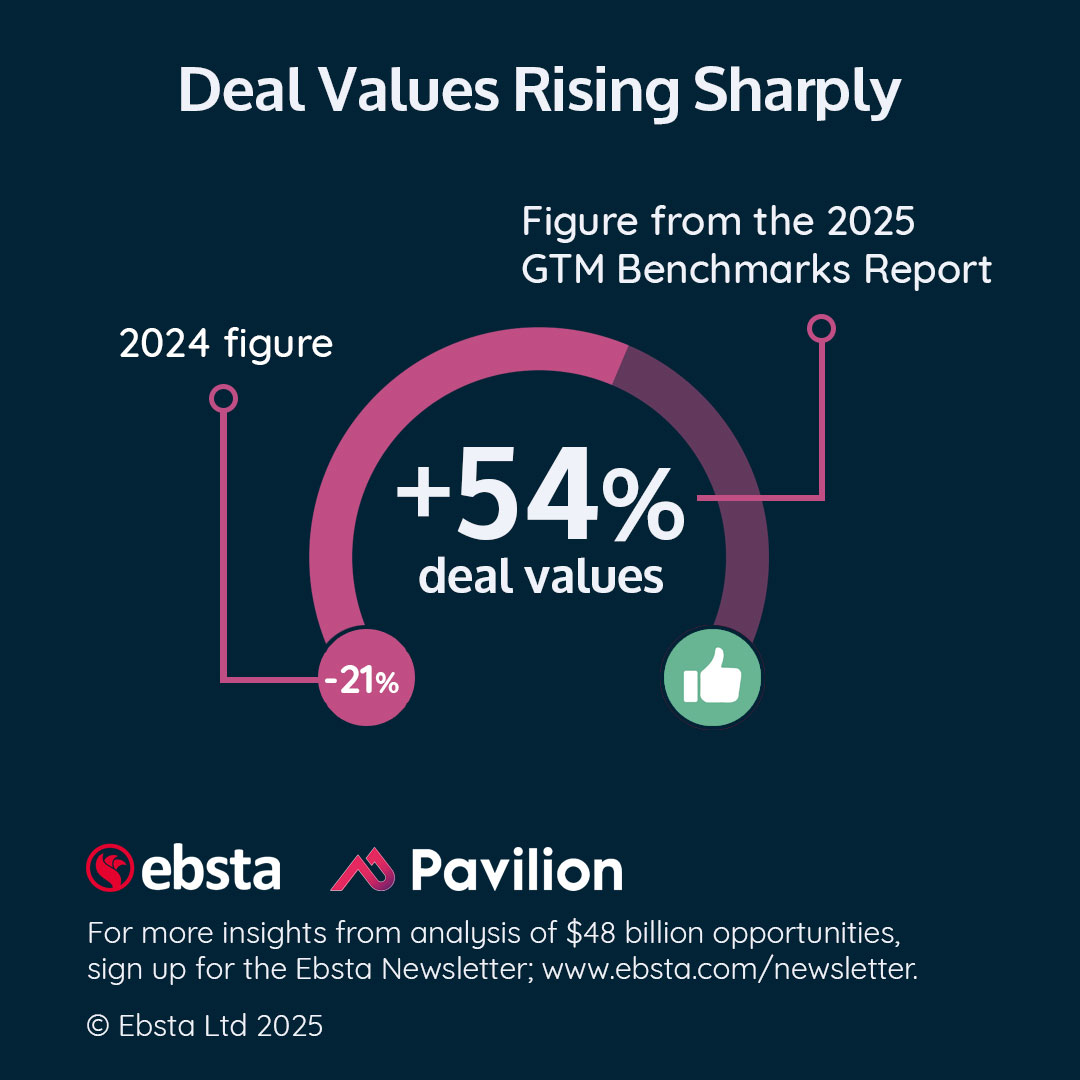
In 2023, deal values fell by -21% amid lengthening sales cycles (+16%) and plummeting win rates (-18%).
But in 2024, a +54% surge signals renewed buyer confidence. Shorter cycles (-9%) and fewer slipped deals (36%) drove momentum, though rising quota misses (78%) highlight an increasingly competitive landscape.
#2025GTMbenchmarks
In 2023, macroeconomic uncertainty and longer sales cycles drove a -21% drop in deal values.
By 2024, improved buyer confidence and agile GTM strategies propelled a remarkable +54% rebound. Shorter sales cycles, fewer slipping deals, and stabilizing win rates underscore how flexible sales teams can capitalize on renewed market momentum.
#2025GTMbenchmarks
Quick LinkedIn Post
Optimised for social media
Sellers Missing Quota
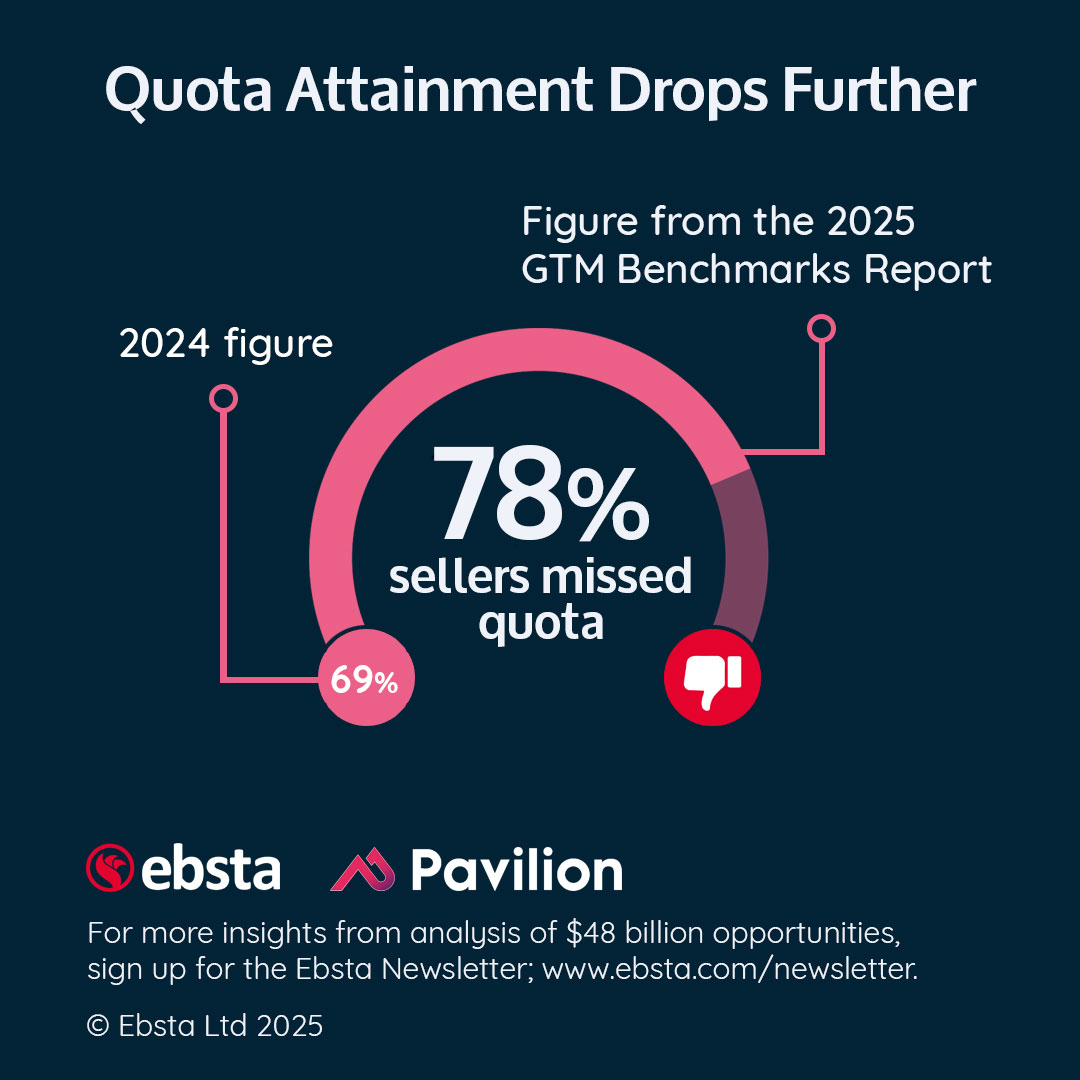
In 2023, 69% of sellers missed quota, rising to 78% in 2024, according to Ebsta’s GTM Benchmarks.
Competition, dropping win rates (-18% in 2023, -10% in 2024), and shifting buyer behavior inflated pipelines yet stalled conversions. These dynamics, plus prolonged sales cycles and slipping deals, contributed to mounting quota shortfalls.
#2025GTMbenchmarks
Tech sellers are struggling more than ever - 78% missed quota in 2024, up from 69% in 2023. Why?
Win rates continue to fall (-10%), while the gap between top and bottom sellers has widened (now 11x). Despite shorter sales cycles and higher deal values, inconsistent performance is making hitting targets harder.
#2025GTMbenchmarks
Quick LinkedIn Post
Optimised for social media
Velocity Delta
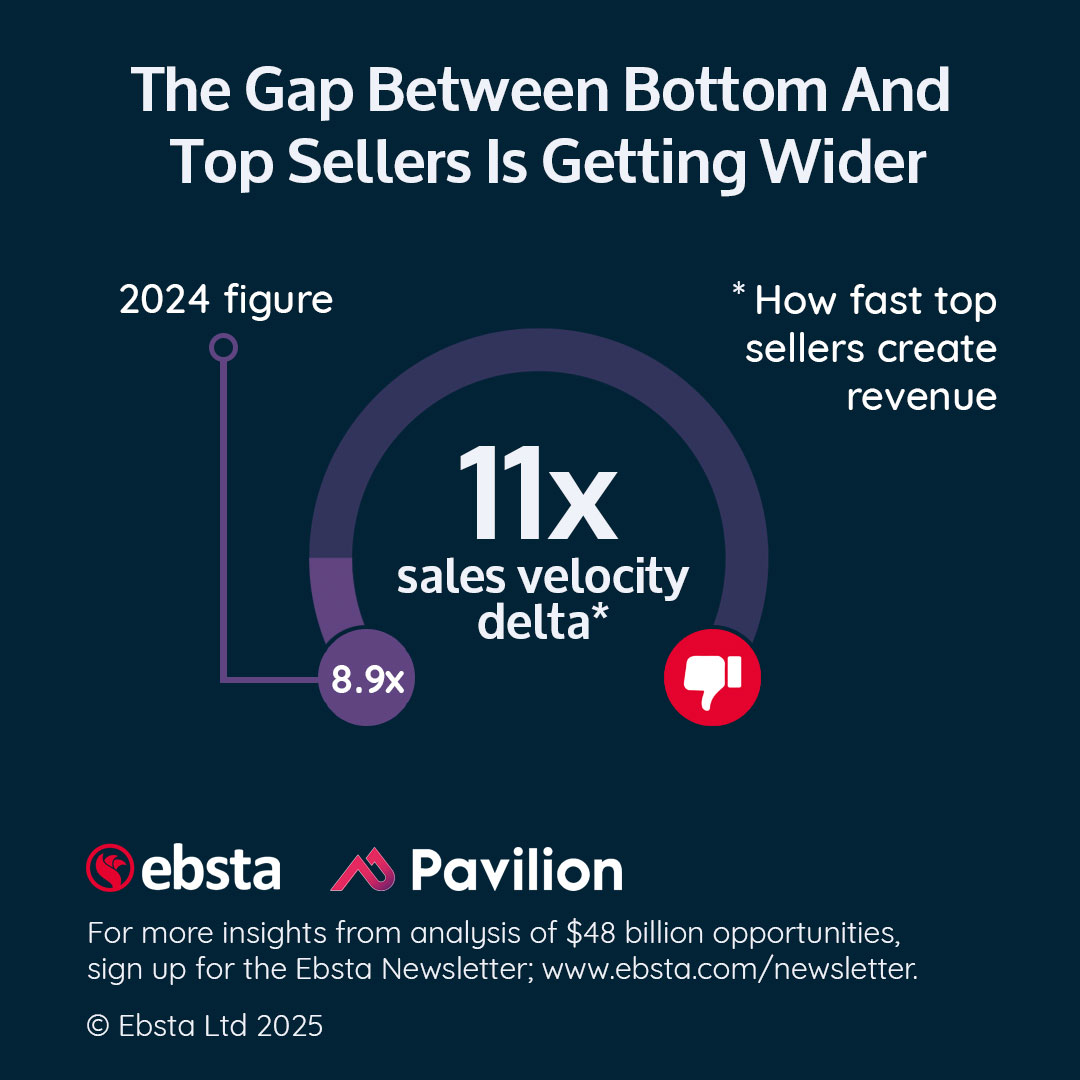
The sales velocity delta has soared from 8.9x to 11x in 2024. It reflects how fast top and bottom sellers generate revenue. The gap is growing.
Plunging win rates (-18% in 2023, -10% in 2024), fluctuating deal values (-21% then +54%), and shifting sales cycles (+16% then -9%) fueled this imbalance, significantly intensifying performance pressure across tech industries.
#2025GTMbenchmarks
The gap between top and bottom sellers has widened. The difference in speed with which they create revenue has risen from 8.9x to 11x in 2024. Why?
Despite shorter sales cycles (-9%) and higher deal values (+54%), win rates continued to decline (-10%), and more sellers missed quota (78%). Elite sellers adapted faster, while others struggled; intensifying the revenue divide.
#2025GTMbenchmarks
Quick LinkedIn Post
Optimised for social media
Deals Slipped
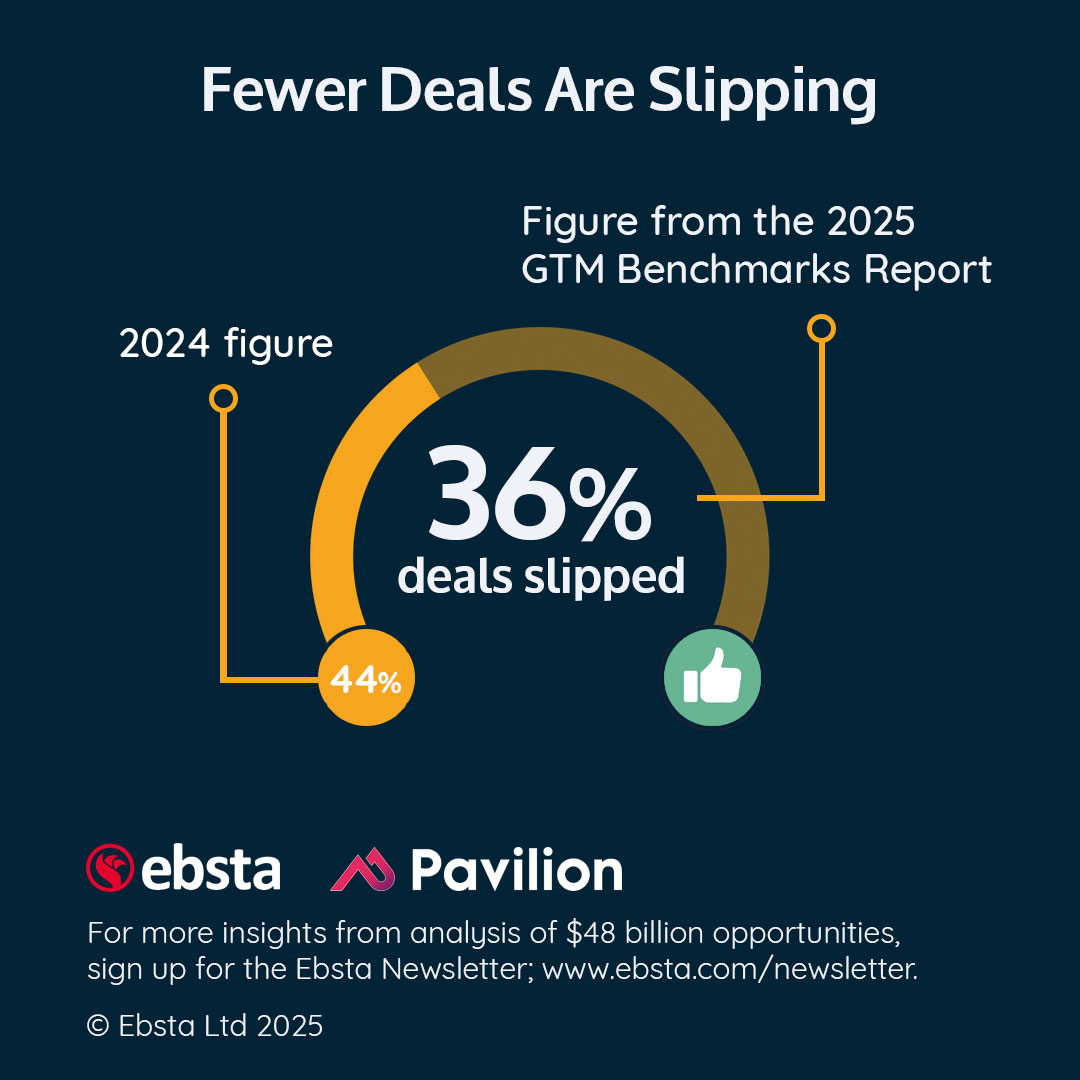
In 2023, 44% of deals slipped, reflecting extended sales cycles (+16%) and depressed win rates (-18%). But by 2024, things had changed.
Slippage fell to 36% as tech firms streamlined processes and shortened sales cycles (-9%). Although sellers still struggled with quotas (78% missed), more focused pipeline management drove overall better deal execution.
#2025GTMbenchmarks
Tech firms saw deal slippage improve from 44% in 2023 to 36% in 2024 (Ebsta’s GTM Benchmarks Report).
Shorter sales cycles (-9%) and rising deal values (+54%) likely helped. However, win rates remain low, and more sellers are missing quota - highlighting ongoing challenges despite better deal execution.
#2025GTMbenchmarks
Quick LinkedIn Post
Optimised for social media
Most Efficient Channels
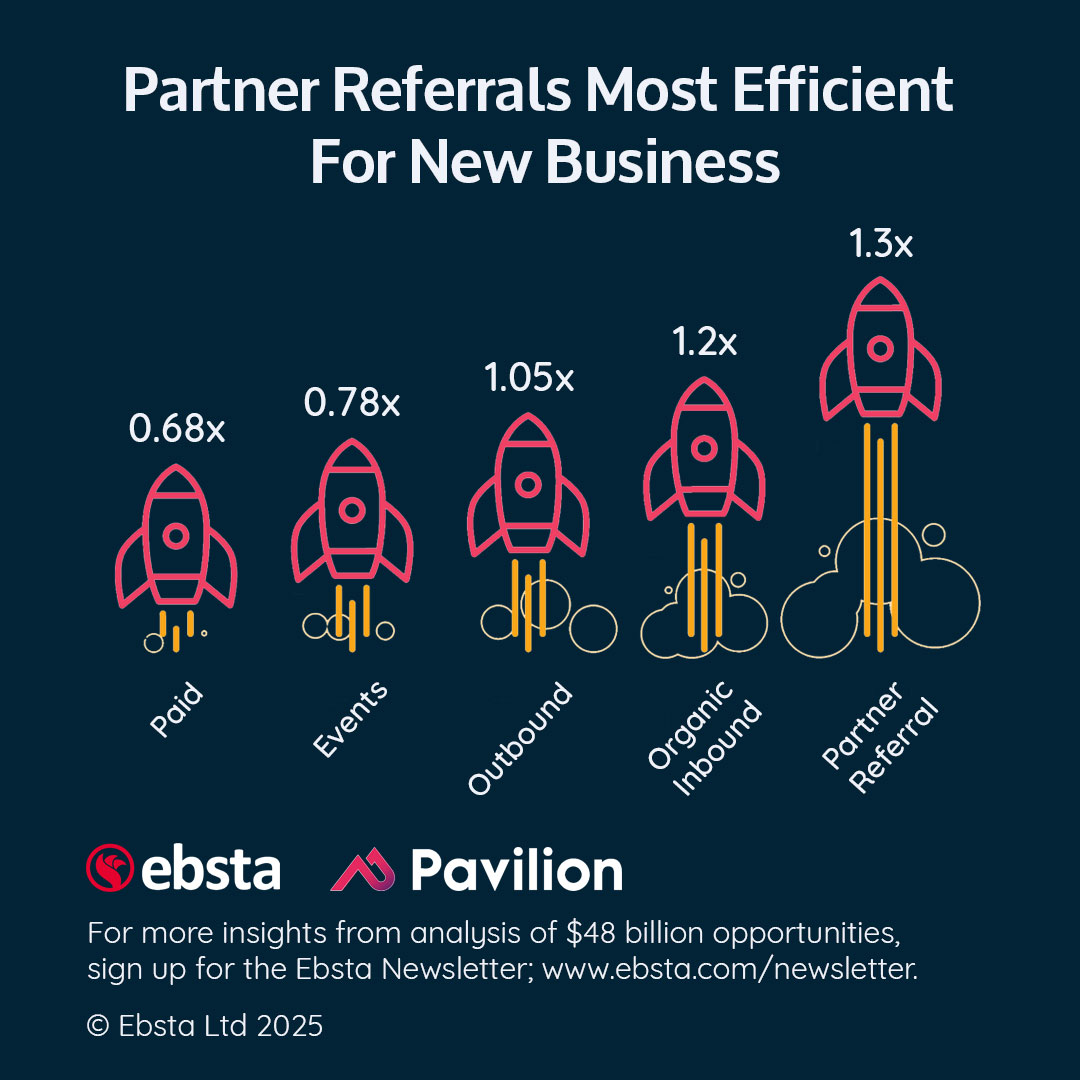
Channel efficiency - calculated by (win rate × ACV) / sales cycle - significantly impacts overall revenue and profitability.
According to Ebsta’s GTM Benchmarks, partner referrals proved 1.3x more efficient than other channels across $48Bn in opportunities. By prioritizing the most efficient channels, tech firms can optimize growth and strengthen their competitive edge.
#2025GTMbenchmarks
Tech firms gain crucial insights by comparing efficiency among channels like organic inbound (1.2x), outbound (1.05x), events (0.78x), and paid (0.68x).
Partner referrals lead the pack at 1.3x. This data underscores the strategic value of focusing resources on the strongest channels to enhance returns and drive meaningful, sustainable growth.
#2025GTMbenchmarks
Quick LinkedIn Post
Optimised for social media
Customer Expansion
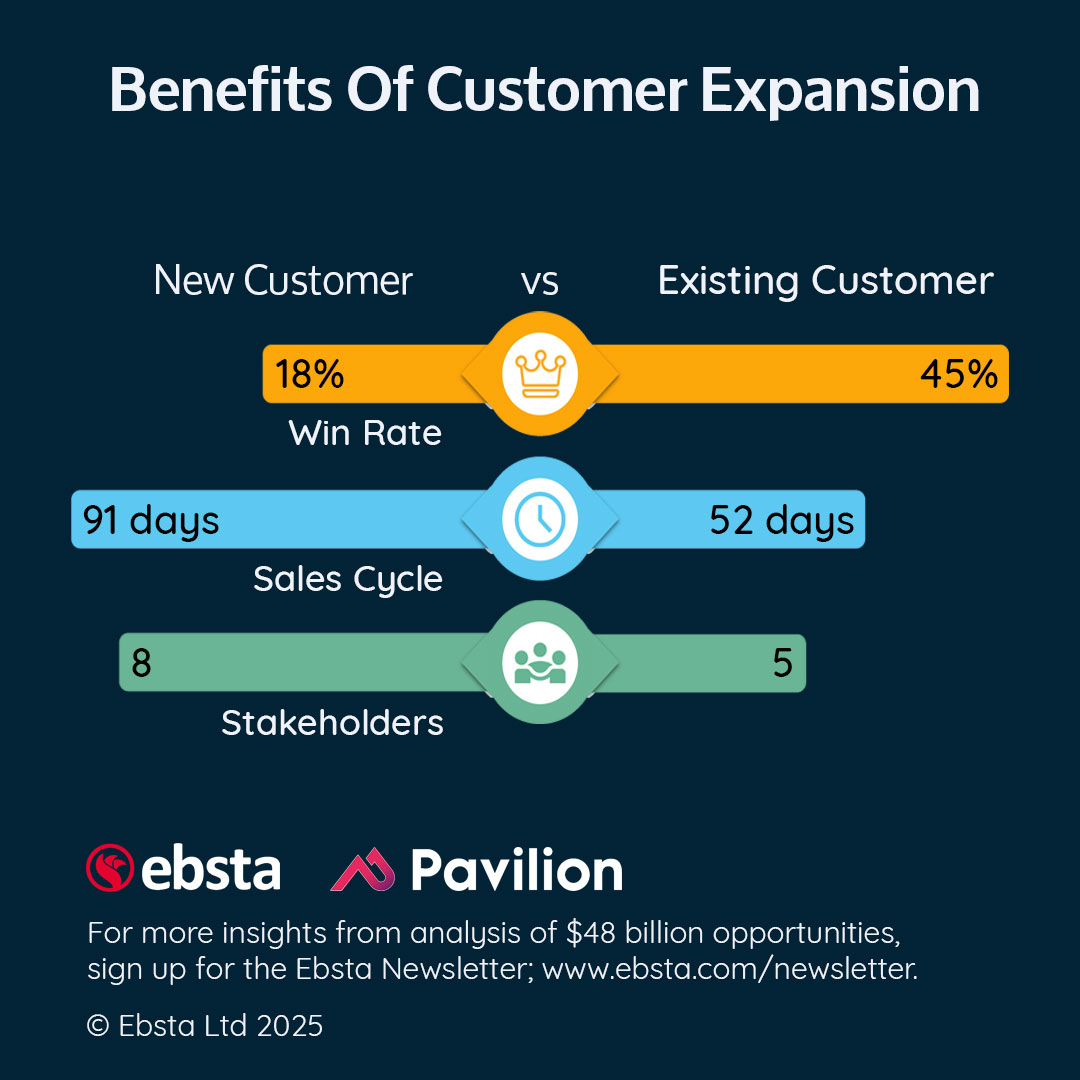
Tech companies can accelerate revenue by focusing on existing clients. With a 45% expansion win rate versus 18% for new deals.
Customer expansion also yields faster outcomes (sales cycles of 52 days instead of 91) and involves fewer decision-makers. It’s a proven approach that strengthens relationships and consistently drives sustainable, long-term growth.
#2025GTMbenchmarks
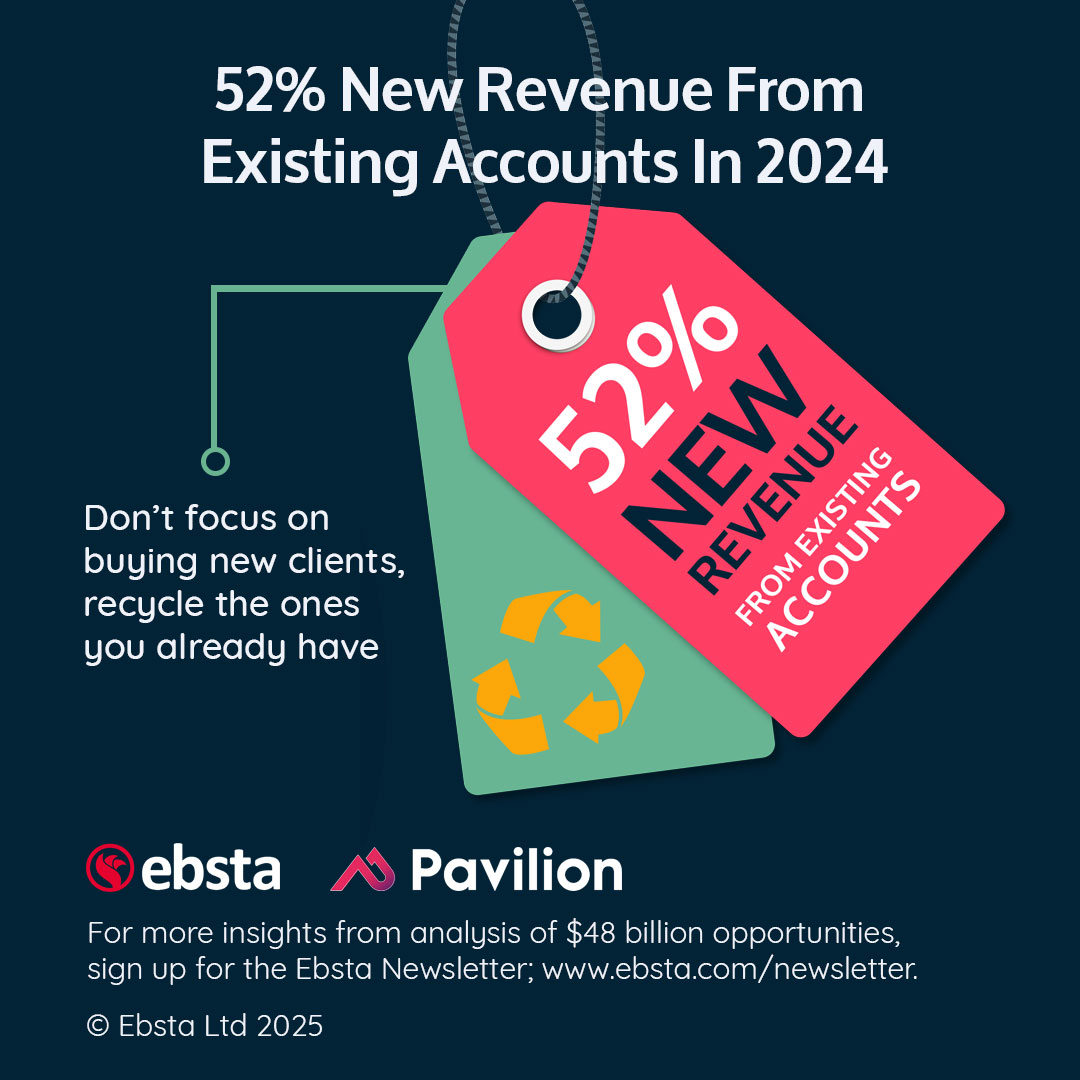
Customer expansion is key to sustainable growth. In 2024, 52% of new revenue came from existing clients.
By upselling and cross-selling, tech firms enjoy higher win rates (45% vs 18%), fewer decision-makers (5 vs 8), and shorter sales cycles (52 days vs 91 days). It’s a faster, more reliable strategy.
#2025GTMbenchmarks
Quick LinkedIn Post
Optimised for social media
Selling Time Per Day
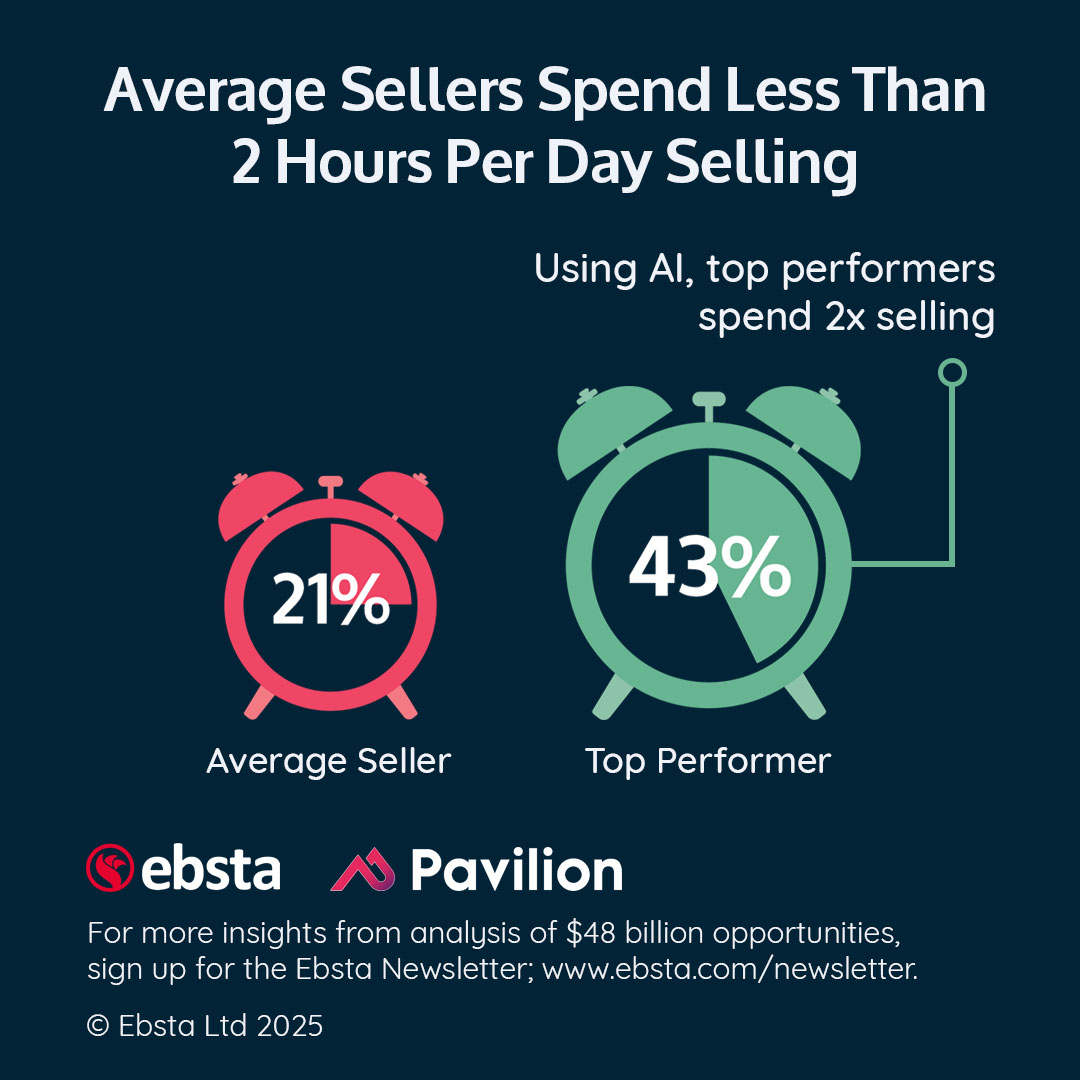
Time is a seller’s most precious asset, yet routine tasks consume most of the day. Sellers who reclaim lost hours through AI-driven automation consistently outperform peers.
They nurture customer expansion by building trust, accelerating deal velocity, and uncovering new revenue streams. This balanced approach fortifies companies for sustainable success.
#2025GTMbenchmarks
Time is a seller’s most precious asset, yet routine tasks consume most of the day. Leaders who reclaim lost hours through AI-driven automation consistently outperform peers.
They nurture customer expansion by building trust, accelerating deal velocity, and uncovering new revenue streams. This balanced approach fortifies tech firms for sustainable success.
#2025GTMbenchmarks
Quick LinkedIn Post
Optimised for social media
Missing Contacts
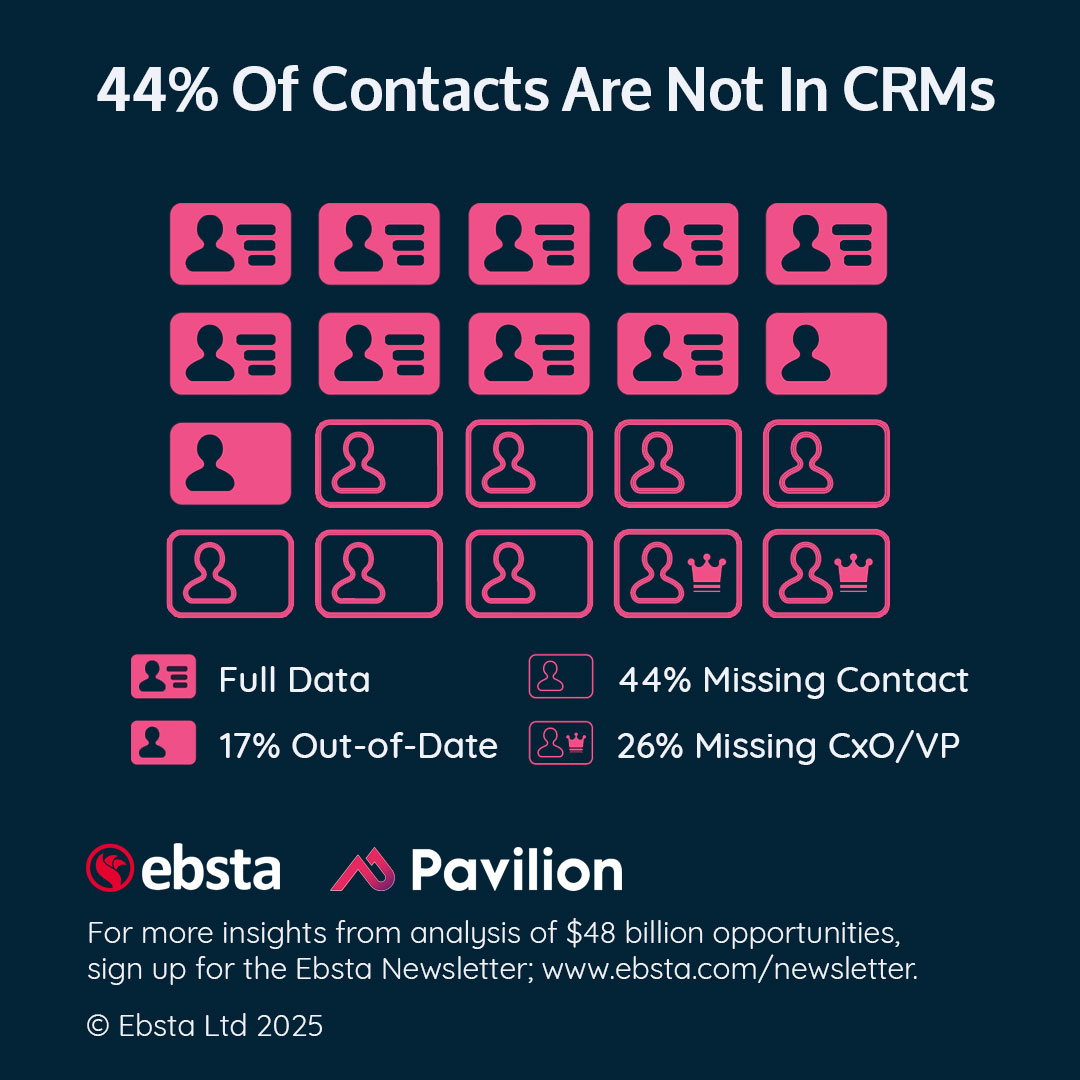
Beneath every effective AI strategy lies clean, comprehensive data. Currently, 44% of sales contacts are not in CRMs, with a quarter of those being senior decision-makers vital to expansions.
Without accurate insights, valuable multi-threading opportunities slip away. By investing in automation, organizations can capture data that powers AI for truly significant growth.
#2025GTMbenchmarks
AI can propel customer expansion, but incomplete contact records undermine potential. With 25% of missing contacts at the CxO level, critical stakeholders remain invisible.
Automating data capture ensures AI-driven insights remain highly accurate and actionable. It’s the only way to spot engagement gaps early and protect revenue from vital relationships.
#2025GTMbenchmarks
Quick LinkedIn Post
Optimised for social media
New Revenue
In 2024, 52% of new revenue came from existing clients. The GTM Benchmarks Report reveals that customer expansion offers a 45% win rate versus 18% for new customer acquisition; and requires fewer stakeholders (5 v. 8) in a shorter sales cycle (52 vs. 91 days).
So, don’t just buy new clients, recycle the ones you have!
#2025GTMbenchmarks
Customer expansion not only boosts revenue but also accelerates the path to profitability. With a 45% win rate and a significantly shorter sales cycle, it drives predictable growth for tech firms.
By nurturing existing relationships, you reduce costs and complexity. Remember, don’t buy new clients, recycle the ones you have!
#2025GTMbenchmarks
Quick LinkedIn Post
Optimised for social media
Ongoing Engagement
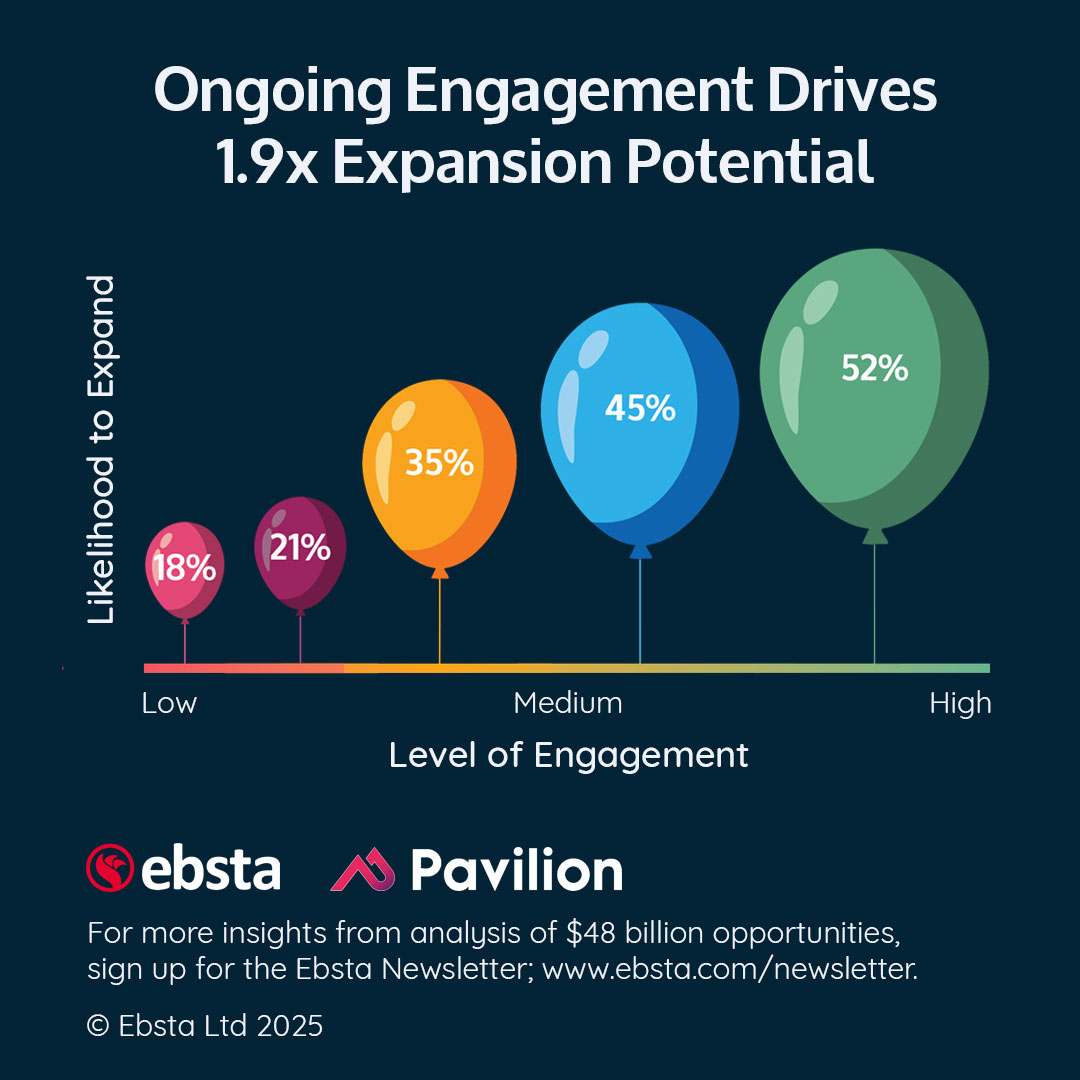
Sustained customer engagement boosts expansion opportunities by 189% and positions tech firms for long-term success.
Regular C-suite touchpoints reveal evolving needs, encouraging growth. By consistently delivering value-driven interactions, businesses strengthen loyalty, reduce churn, and drive revenue.
#2025GTMbenchmarks
Tech firms that maintain consistent stakeholder alignment uncover fresh opportunities and remain indispensable.
Regular dialogues with the C-suite pinpoint shifting priorities, enhancing loyalty and unlocking expansion. Proactive engagement resolves issues before they escalate.
#2025GTMbenchmarks
Quick LinkedIn Post
Optimised for social media


