Share this article
Learn from the brightest minds how to predictably and efficiently grow revenue.
Related Content
5 Ways to Use the Ebsta Integration With HubSpot to Improve Sales Performance
How to improve adoption of HubSpot with Ebsta
B2B Sales Benchmarks: 2023 H1 Update
The latest update from the 2023 B2B Sales Benchmarks analysis of over $37bn in pipeline.
How to improve AE quota attainment (according to data)
23% of reps are contributing 83% of revenue. Here's how to solve it (with data)
7 powerful metrics to get the most out of analyzing your sales pipeline
Your sales pipeline provides a snapshot of where your prospects are in your sales process.
It is the key to understanding and managing deals on an individual level at every stage of the sales process. This allows you to identify when deals are stagnant, the reasons for this, and the next steps you need to take to move these deals forward.
In order to achieve this high level of visibility, your pipeline needs to be up to date with all the relevant data to ensure it accurately reflects the true state of your pipeline.
Why do you need to analyze your pipeline?
One of the main benefits of analyzing your pipeline is that it provides insights into how opportunities are progressing, and where issues are occurring in your pipeline. This enables you to identify actionable next steps and identify issues before they occur.
These actionable insights allow sales teams to react in real-time.
The next step is analyzing historical data that can help you to isolate points in your pipeline where deals are consistently falling through.
These insights help you to understand why these issues keep occurring and create a plan to prevent them from happening again.
These changes may seem small at the time, but marginal gains can have a significant impact.
For example, if your deals keep falling through at the negotiation stage, this suggests that you or your sales reps need to work on the way you negotiate. So, if you were losing 5 deals every month at the negotiation stage, you would be losing 60 deals a year. Identifying these roadblocks can increase your chances of success.
Analyzing your pipeline gives you a better picture of which deals are going to close, which deals need nurturing, and which deals need to be cut loose.
By leveraging data and actionable insights to make decisions about your pipeline, it helps reps to make educated predictions on what to forecast – rather than relying entirely on a gut feeling.
It allows you to review past performance to improve your processes, take a data-driven approach to coach your sales reps, and ensure you are consistently hitting your sales targets.
Metrics You Should Be Tracking
Sales metrics are data points that show how an individual, team, or the company as a whole is performing. It helps track how you are progressing towards your targets. Sales metrics can be useful in a number of ways such as:
- Helps you to be better prepared for future growth
- Allows you to adjust compensation for your sales reps
- Enables you to tweak sales strategies to maximize success
By measuring the right metrics everyone from sales reps to C-suite executives have visibility of how their pipeline is performing in real-time.
This gives you an accurate picture of how you are pacing towards your goals, allowing you to make short and long-term decisions with confidence.
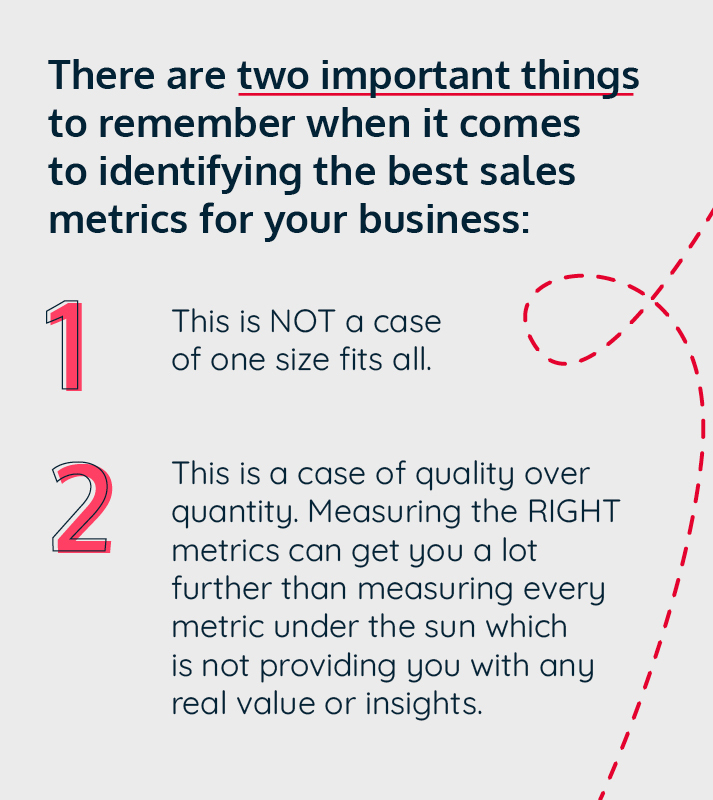
We’ve narrowed down some key sales metrics that have the potential to move the needle for your business.
Download your very own copy of the 7 most powerful sales metrics and why they are so important here.
Download hereSales Velocity
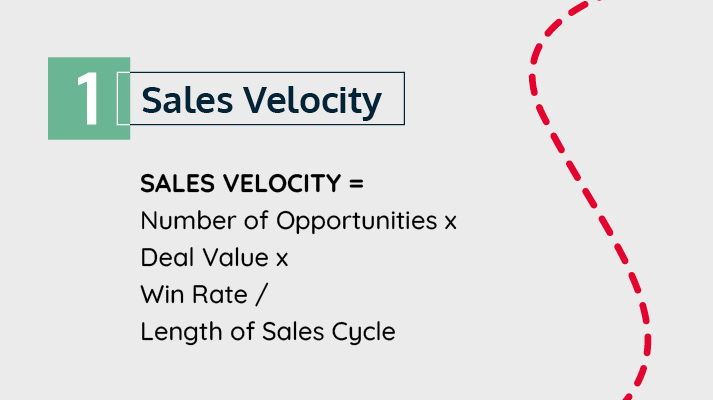
As far as metrics go, this is the holy grail metric. All of the metrics we have covered so far make up sales velocity. This is the speed at which an opportunity moves through your pipeline to a close.
Why is this metric important?
- It tells you the rate at which you are generating revenue.
- Understanding the speed at which customers are moving through your pipeline will help your team to pinpoint where deals are falling through and which steps in your process are working. This can help to fine-tune your sales process. By digging into the components of sales velocity, you can fine-tune your sales process.
- Sales velocity is an indicator of the health of your business. The faster you can turn a lead into a customer, the more successful your business is as you will be bringing in more revenue in a short period of time.
- You will be able to identify how changes in your strategies or other external factors impact your business. It indicates your business’ ability to grow and scale.
- It also allows you to very easily see how your business pacing against other businesses.
It should be noted that increasing your sales velocity as a goal is a non-starter. This is because it has multiple inputs that feed into it. It would be more effective to focus on improving the number of opportunities, deal value, win rates, or the length of your sales cycles as a goal. Sales velocity provides a more holistic view of your pipeline whereas the components of sales velocity provide a more granular view of your pipeline. Let’s take a closer look at the components that make up sales velocity now.
Win Rate
Win rate is the percentage of the number of qualified deals in your pipeline that closed and became customers.
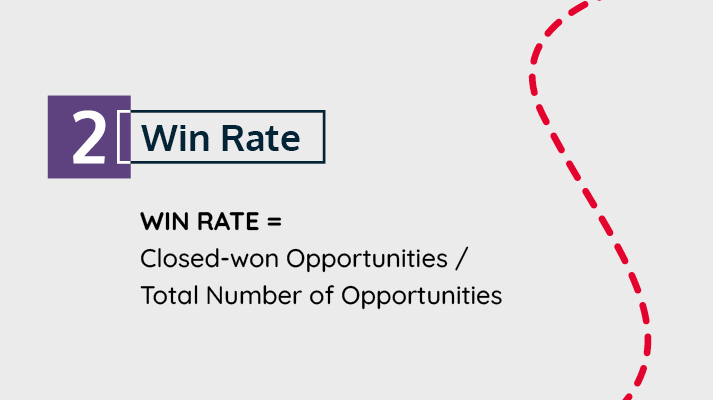
This is the most scrutinized metric and with good reason.
Why is this metric so important?
- Hitting quota – this metric allows you to calculate how much pipeline a rep needs to hit their quota. For example, if a rep has a quota of £10k to hit this quarter and their average win rate is 25% then you need to generate £40k of pipeline to ensure they can hit their quota.
- Coaching sales reps – analyzing this metric can determine which sales techniques are working well and which techniques are not. The strategies that work well can be shared with other reps to further improve your win rates.
- Product insights – you will also be able to identify which products are generating the most sales. Your business can then decide whether they want to focus their efforts on this product or invest in promoting other products that are not selling as well.
- Predict future sales – if your win rate has been consistent for a while, this could act as a signal to finance teams that you can increase your budget in the near future.
An important factor to consider when introducing win rate as a sales metric is to be consistent with your definition of what this means across the company. Different definitions of this metric, or any metric in fact, can lead to an inaccurate metric. This can be dangerous as these metrics are often used to justify and implement business decisions.
Alex Freeman, Head of Delivery at Ebsta, recently discussed the common pitfalls and challenges of building a predictable revenue engine. One of the pitfalls is a lack of common language. Watch the full webinar here.
Sales Cycle Length
This is the number of days it takes for a deal to close and is extremely useful for sales forecasting. By understanding the average amount of time it takes to close a deal, you can create sales projections based on the opportunities in your pipeline.
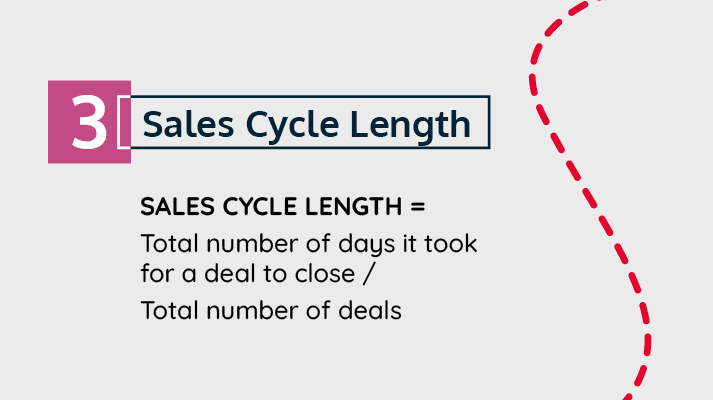
Why is this metric important?
- It allows you to confidently predict the duration of a sales cycle, hence improving your forecasting accuracy. When you measure sales cycle, you can build a picture of the average across reps and teams. Using this, you can begin to estimate the likelihood of a deal closing based on how much time you have left to the close date.
- It gives you great insights into how much time and how many resources it takes on average to win a customer.
- It creates transparency. You will be able to identify where opportunities are stalling in your pipeline by measuring sales cycle length for individual deal stages. You can then use this information to decrease the length of your sales cycle. For example, if teams are spending too much time at the proposal stage and so on so forth.
Average Deal Value
This is the average revenue generated by the deals you have won over a specific period of time.
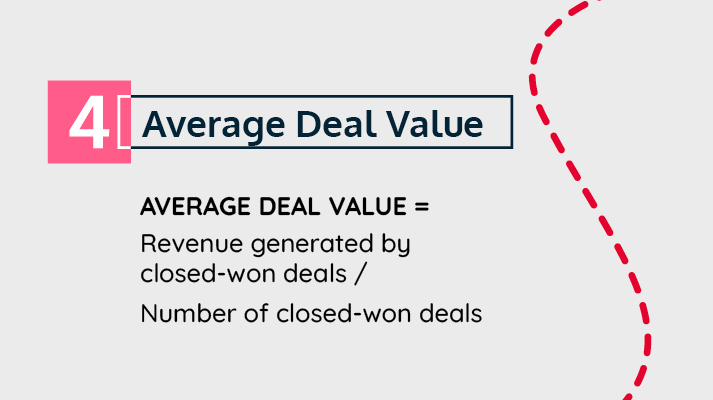
Why is this metric important?
- By analyzing historical deal values, you can compare the differences between what a large deal looks like and what a small deal looks. By analyzing deals of different sizes you can begin to understand what worked and what did not.
- It gives you insights into how likely you are to reach your quota if you look at each deal on a granular level.
- This metric can be compared at a rep level to a team level. For example, if a team is hitting an average deal value of £30,000 and one of your reps is working to an average of £20,000 then there is a conversation to be had there. It allows you to dissect those opportunities and explore all of the different factors that might be affecting their average deal value.
Number of Opportunities
This might seem like an obvious one but you will be surprised at the number of businesses that do not keep track of this metric. This is the number of opportunities that are currently being worked on in your pipeline.
Why is this metric important?
- This metric is required to calculate a lot of other important metrics and acts as a ‘base’ metric. You will be missing out on a lot of beneficial insights if you are not tracking this metric.
- Understanding the number of opportunities in your pipeline enables you to effectively manage your time or guide your team on the deals that they should be focusing on within a given period of time.
Want your own copy of these 7 amazing metrics on hand? Download it here
Download hereNow we’ve covered the basics…
The metrics we have covered will provide you with rich actionable insights but the metrics coming up next will equip you with the context you need to understand how effective your sales activity really is.
Relationships
By measuring the strength of your relationships with each individual stakeholder you are able to gauge whether they are being correctly nurtured or not.
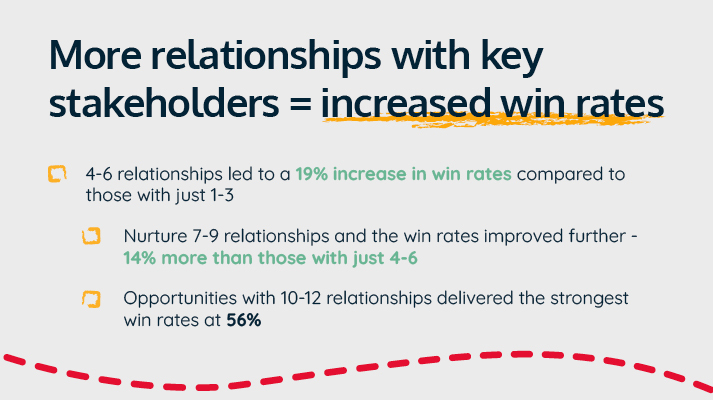
We analyzed $100 billion of pipeline and uncovered the optimal number of relationships resulting in closed won deals is 7 to 9 relationships. This makes sense because there is no longer just one decision-maker involved in the buying process.
Why is this metric important?
- Relationships are so important because they underpin win rate and sales cycles – therefore sales velocity as well. The more relationships you build, the more likely you are to succeed and with shorter sales cycles.
- Identify which key stakeholders need more attention to increase your chances of successfully closing a deal.
We’ve come up with a 5-step process to make this process as simple as possible. It can help you to unlock how well key decision-makers are engaged, prioritize relationships with stakeholders who matter most, and build a process that you can refine and improve over time.
Engagement
Measuring engagement across the customer journey can be incredibly impactful in identifying where opportunities are at risk. How do you measure engagement?
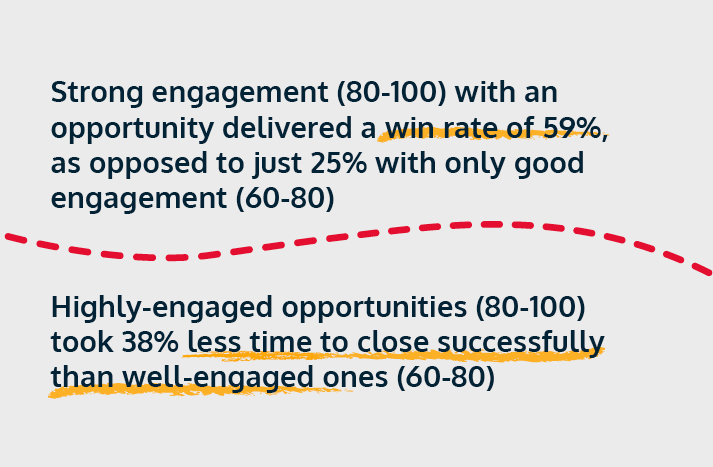
The Ebsta Score is a score between 1 and 100 that measures engagement. Put simply, the more interactions you have with a prospect, lead or opportunity, the higher the score. Learn more about what the score is and how it is calculated here.
Why is this metric important?
- It can help sales leaders to easily identify which opportunities are being actively worked by their reps and where opportunities risk falling off because of a lack of engagement. Sales leaders can use this information to coach their reps to refocus their efforts.
- Allows sales leaders to make changes to their forecast to accurately reflect their pipeline. For example, if an opportunity has a low engagement score it may signal to sales leaders that it is unlikely to close this month then the forecast can easily be changed.
- Identify who in your business has the strongest relationship and leverage these relationships to increase your chances of closing a deal.
Conclusion
Measuring the right sales metrics can take your business to the next level. You will be able to easily identify opportunities at risk, improve the performance of your sales reps with specific coaching feedback, give you space to grow and scale and improve the accuracy of your forecast. Who would have thought a metric would be so powerful?
Refer back to our 7 essential metrics whenever you want and download your own copy here
Download here