Preparing for your QBR can be time consuming, tedious and exhausting.
Here's how:
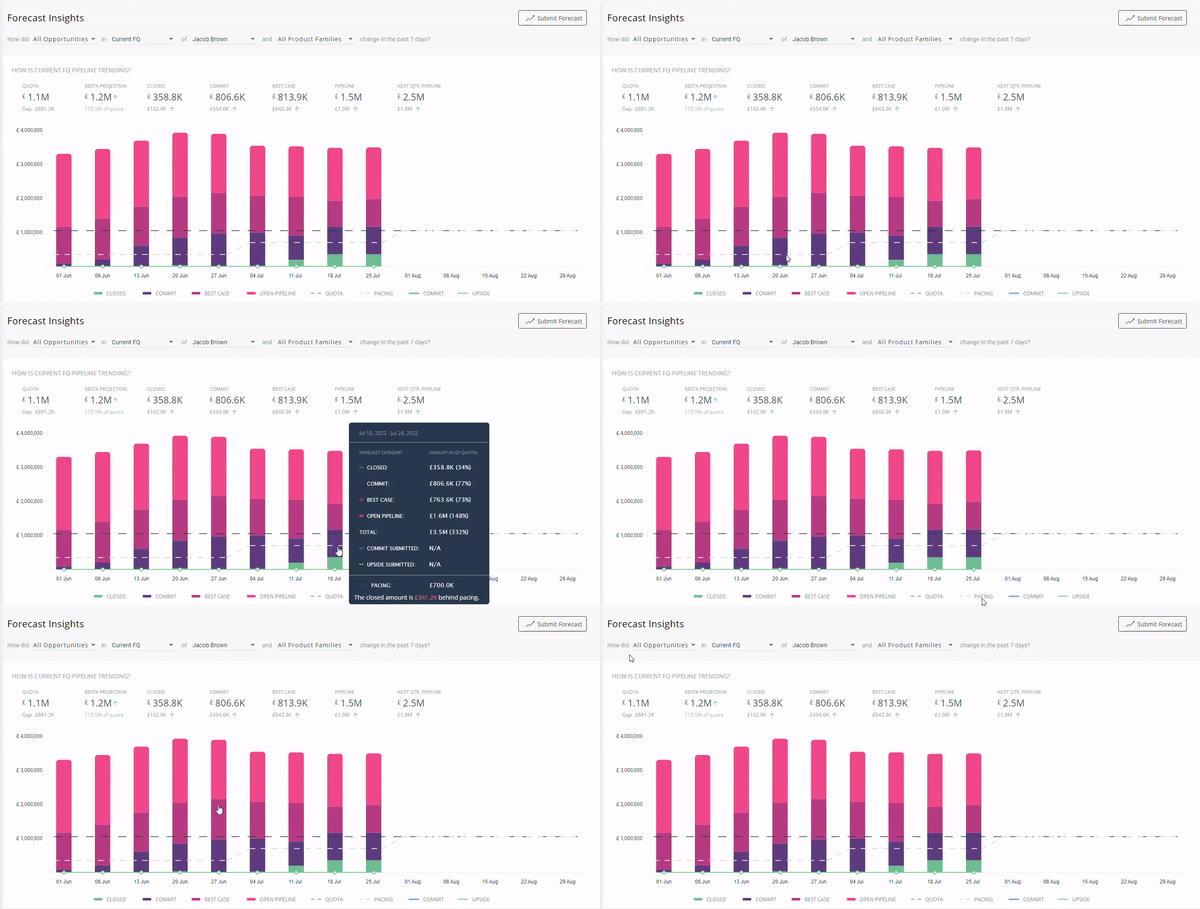
1. How accurate was the forecast through the quarter?
One way of improving your forecasting accuracy is to check how accurate your previous forecasts have been. To find out this information use the Insights filter to filter by previous quarter and scroll to the Opportunity Trend Chart. From here you can see how accurate your forecast was compared to what you actually closed.
2. What was the win %?
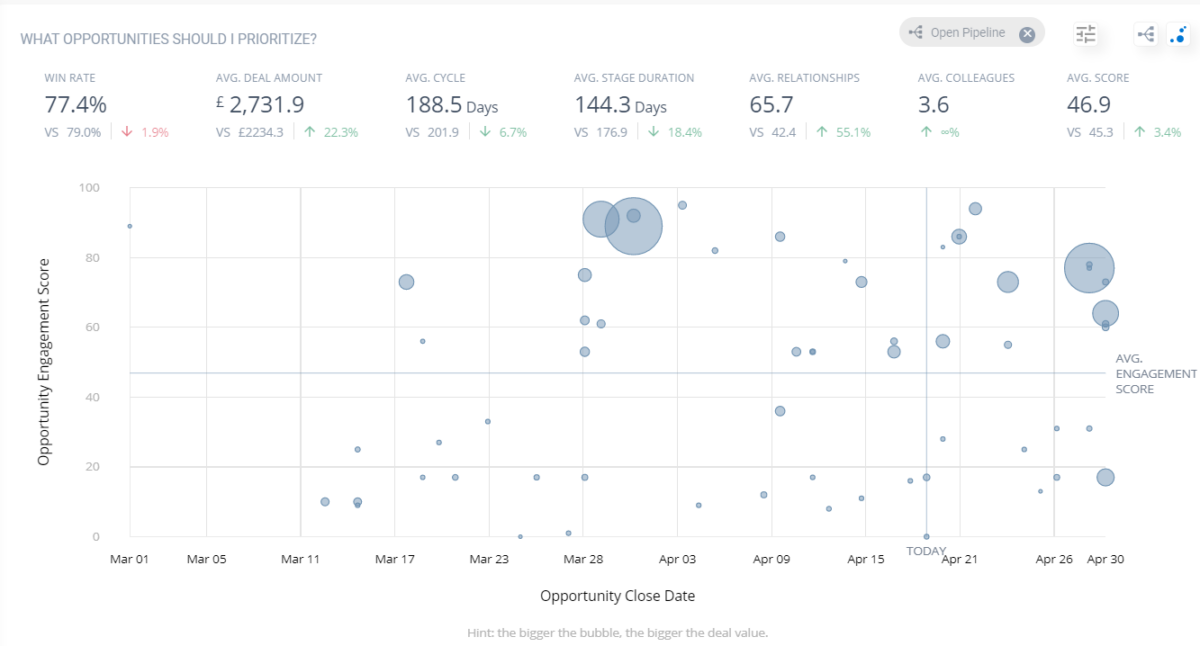
Ebsta provides you with the metrics you need to accurately review performance. Now scroll down to the Opportunity Flowchart and select the bubble icon in the right hand corner.
This will take you to the Opportunity Horizon Chart where you can see the win % as well as other key metrics in the tiles at the top.
- In order to improve this figure you could look at the Ebsta Deal Inspection Guide to ensure that you are getting the most out of your opportunities.

3. What was the sales velocity?
To find your sales velocity we are going to use the Opportunity Horizon Chart again. From here you can see the key metrics in the tiles at the top.
In order to find out your sales velocity just use this sum:
Number of Opportunities x Average Deal Value x Win Rate / Length of Average Sales Cycle
To improve this figure, leverage the Ebsta Deal Inspection Guide to ensure you are covering all of the bases.

4. What was your average deal value?
Understanding your average deal value allows you to know how much time and effort you should be spending on each opportunity to get an ROI.
Now scroll down to the Opportunity Flowchart and select the bubble icon in the right hand corner. This will take you to the Opportunity Horizon Chart.
From here you can see where the average deal amount is in the tiles at the top.
5. Which deals were pushed and why?
Identifying which deals were pushed and the reasons why is a great way to ensure the same mistakes are not repeated.
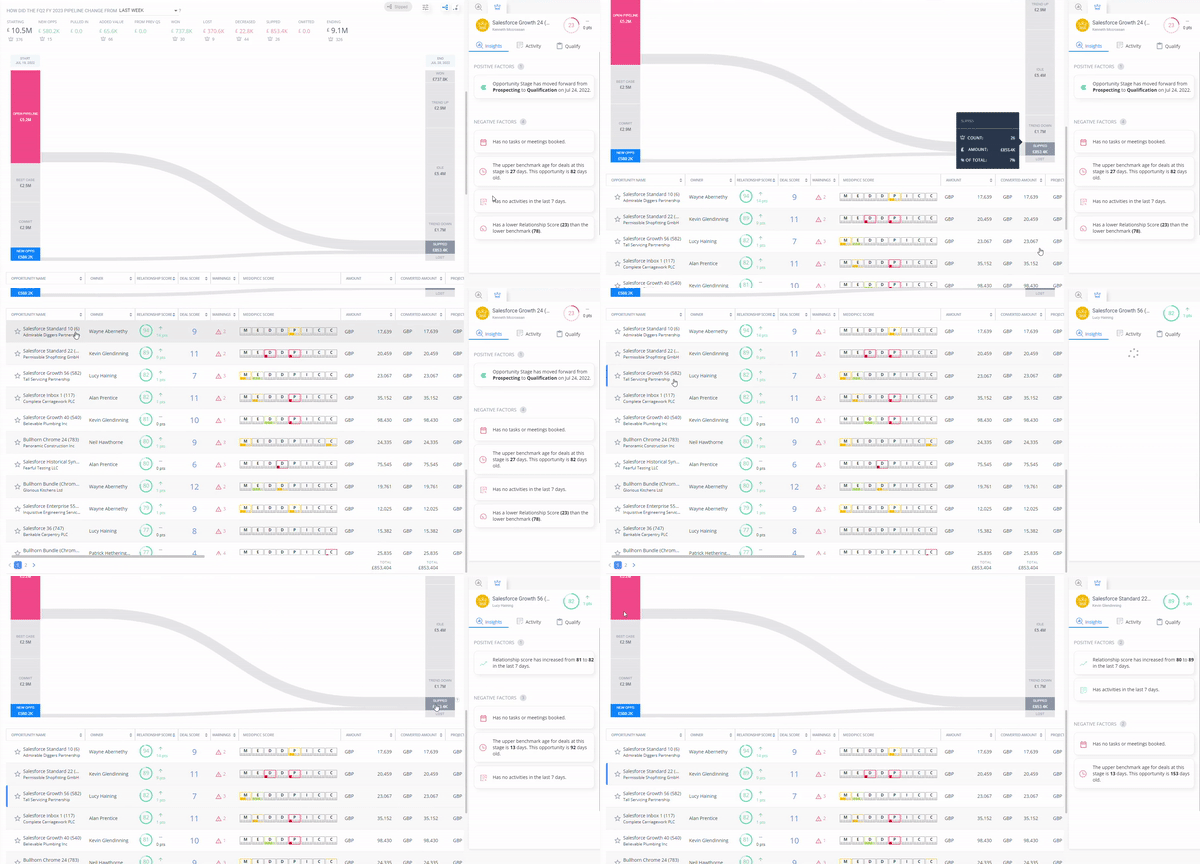
To find these deals use the Opportunity Flowchart. From here you will be able to identify deals that have slipped on the right hand side of the chart. When you select slipped, the Opportunity Table below will be populated with these opportunities. From here you can do a deep dive to see what the Deal Score & Engagement Score are.
Use the Ebsta Insights Tab on the right hand side of the page to look at the Positive and Negative Factors associated with this opportunity as well, giving you 360° degree visibility of the opportunities.
6. Which deals are at risk and unlikely to close?
Identifying deals at risk early is essential to ensuring they are not lost.
Now use the Ebsta Insights tab on the right to show Opportunities to Prioritize. From here you can select the opportunities you would like to review by clicking view opportunities.
Now that you can see the opportunities, you can use the Opportunity Table below to get access to specific details of individual deals.
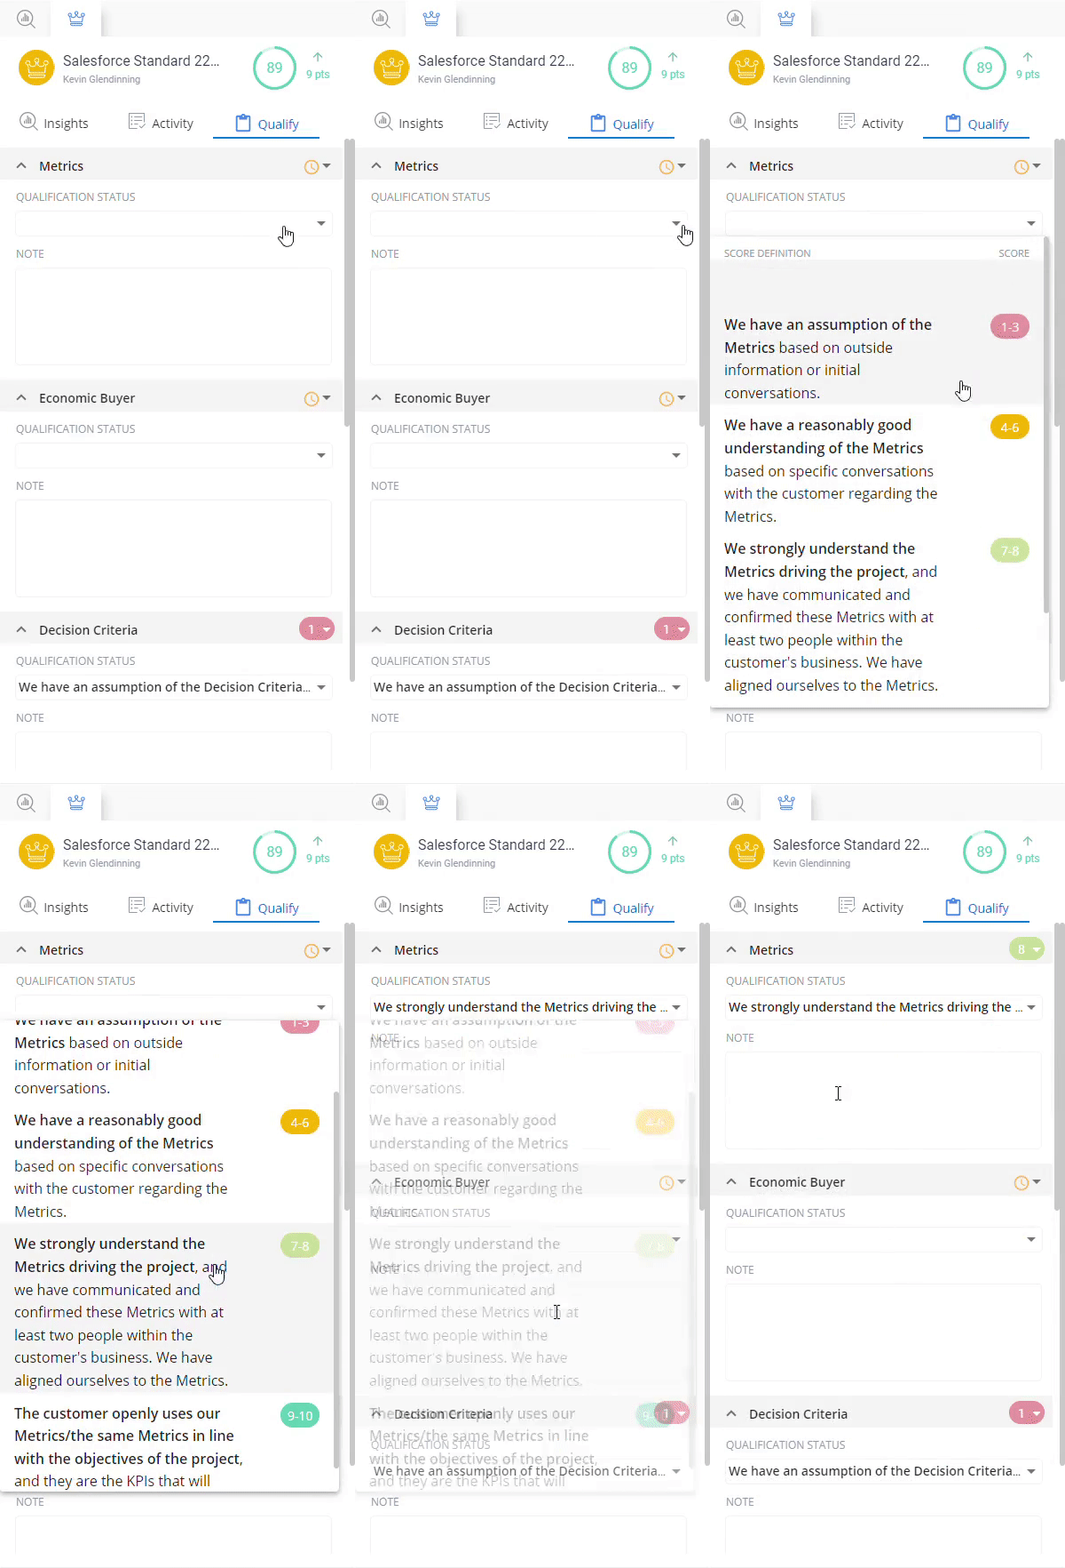
Now you know more about these deals you can plan your next steps to get this opportunity back on track. Use our Deal Qualification Guide to ensure you are covering all bases.
7. Which executives need to be assigned to help the deal close?
Some deals may need a helping hand to close.
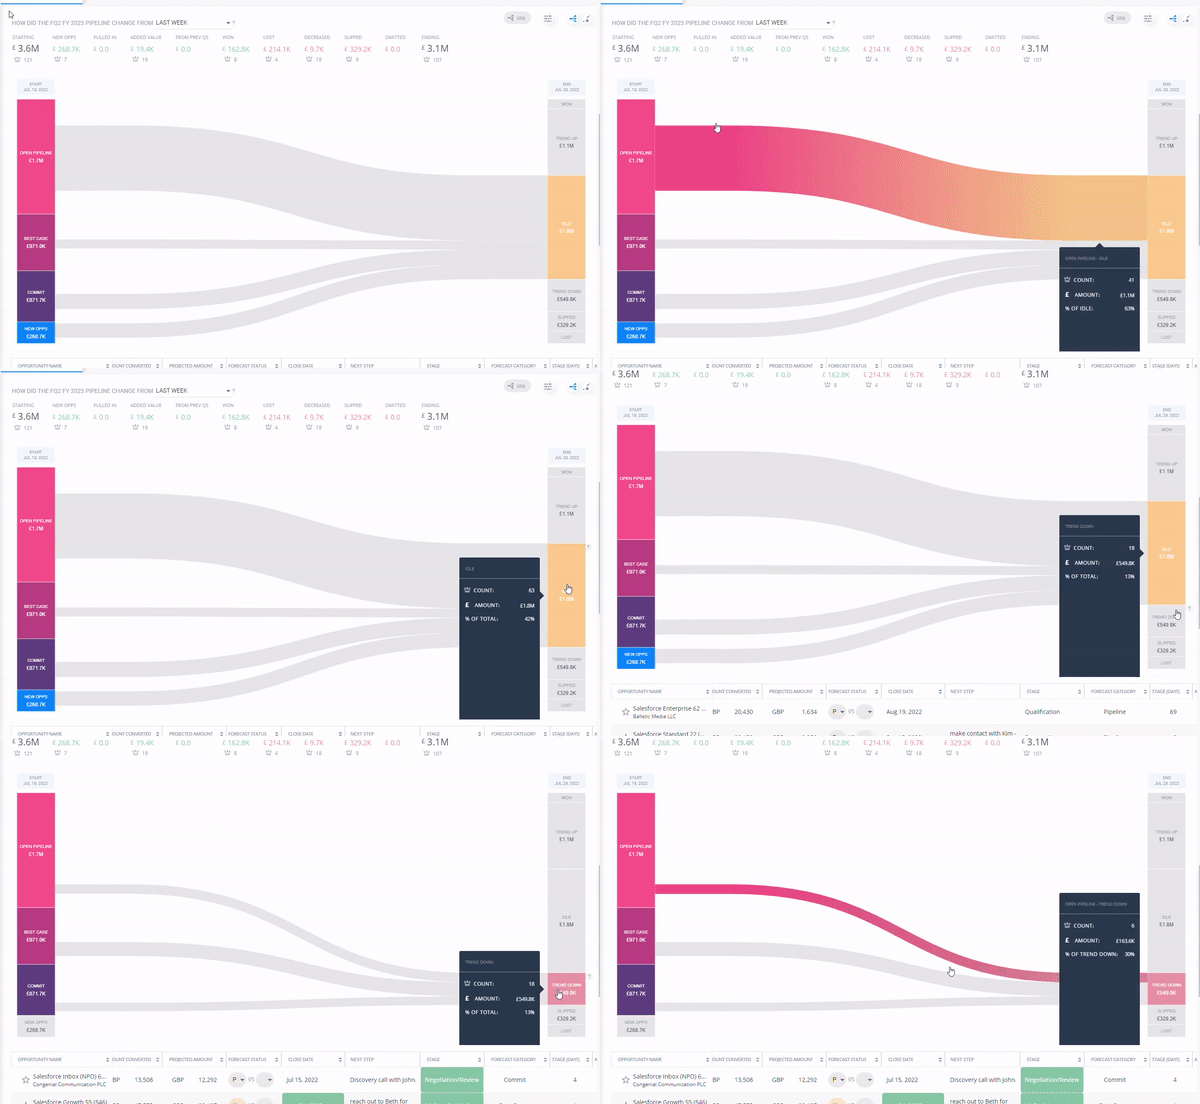
Now scroll down to the Opportunity Flowchart. From here select slipped deals as these are the deals that are highly likely to prevent you meeting your quota and therefore need your attention immediately.
The Opportunity Table below will be filled with the opportunities that need to be prioritized to ensure they close. You can discuss with the reps what they think these deals need to close.
Use Ebsta’s Deal Qualification Guide to ensure the opportunity has an appropriate amount of resources.
